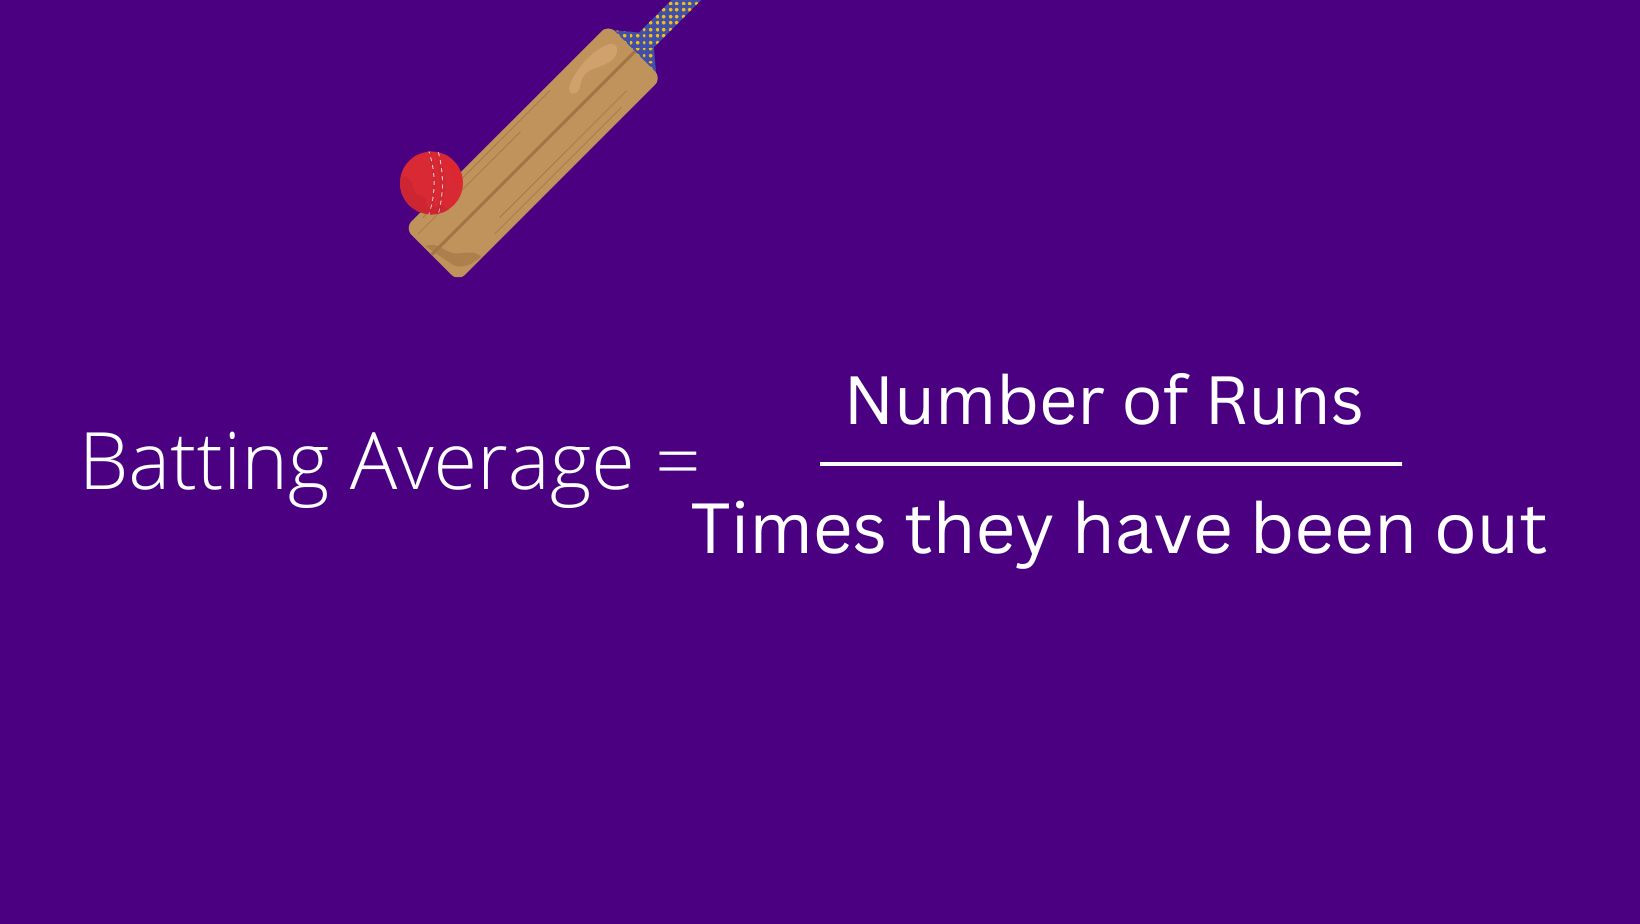
Batting average in cricket is one of the easy ways to analyze a player's past performance in any form of cricket. Batting averages are often used to compare players with each other. The batting average alone can not predict the performance of a batter. Multiple factors need to be considered while measuring the ability of a player.
Batting Average Calculation
A player's batting average is the total number of runs they have scored divided by the number of times they have been out. So when a player gets out less in a cricket format, the player may accumulate a bigger batting average compared to a different player who got out in all innings with the same matches and had the same runs.

Best Batting Average in Test Cricket
| Rank | Batter | Tests | Innings | No | Runs | High Score | Average | Test career dates |
|---|---|---|---|---|---|---|---|---|
| 1 | Don Bradman | 52 | 80 | 10 | 6996 | 334 | 99.94 | 1928–48 |
| 2 | Adam Voges | 20 | 31 | 7 | 1485 | 269* | 61.87 | 2015–16 |
| 3 | RG Pollock | 23 | 41 | 4 | 2256 | 274 | 60.97 | 1963–70 |
| 4 | George Headley | 22 | 40 | 4 | 2190 | 270* | 60.83 | 1930–54 |
| 5 | Herbert Sutcliffe | 54 | 84 | 9 | 4555 | 194 | 60.73 | 1924–35 |
| 6 | Steve Smith | 87 | 154 | 18 | 8161 | 239 | 60.00 | 2010–present |
| 7 | Eddie Paynter | 20 | 31 | 5 | 1540 | 243 | 59.23 | 1931–39 |
| 8 | Ken Barrington | 82 | 131 | 15 | 6806 | 256 | 58.67 | 1955–68 |
| 9 | Everton Weekes | 48 | 81 | 5 | 4455 | 207 | 58.61 | 1948–58 |
| 10 | Wally Hammond | 85 | 140 | 16 | 7249 | 336* | 58.45 | 1927–47 |
- The batting average does not depend on the number of matches a player played in their carrier.
- The batting average tends to be on the lower side for lower-end players
- A player with a good batting average can be considered a finisher. Usually, a player needs to play long innings to have a better average.
- The player's batting average tends to increase if he has an excellent ability to protect his wicket.
- It is better to consider the batting average separately in each format of cricket.


